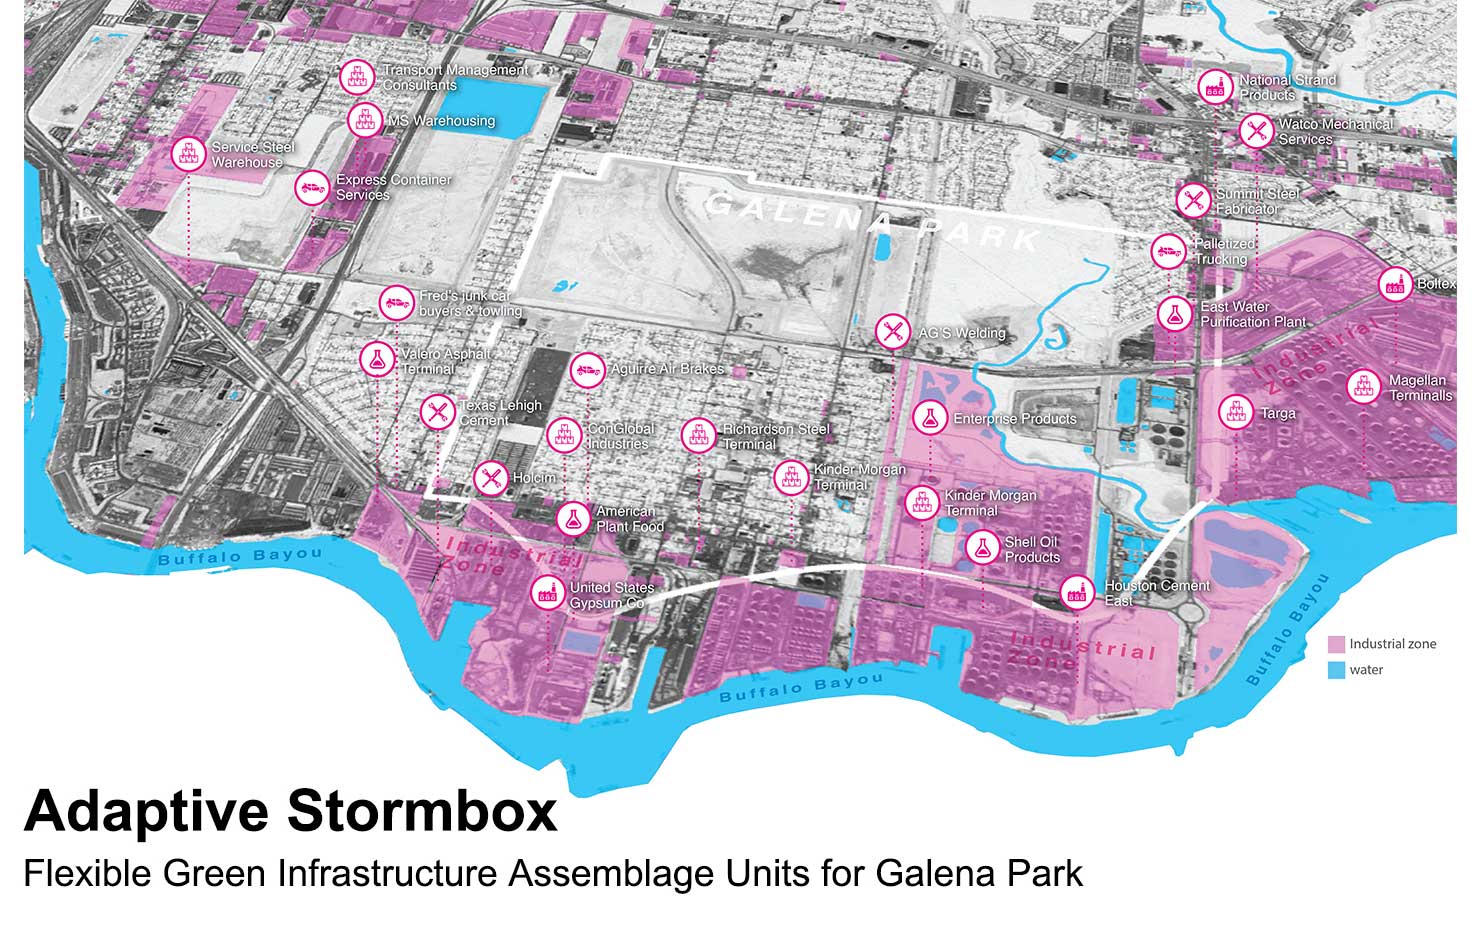
Galena Park, located in Harris County, Tx, home to one of the world’s largest collections of petrochemical complexes, is a space-constrained and overly developed community where it is challenging to implement green infrastructure (GI) in retrofit projects to reduce flooding and pollution. Galena Park contains fully developed areas with limited on-ground undeveloped spaces and complex underground utilities (like pipes and cables that transport electricity, natural gas, water, sewage, and telecommunications).
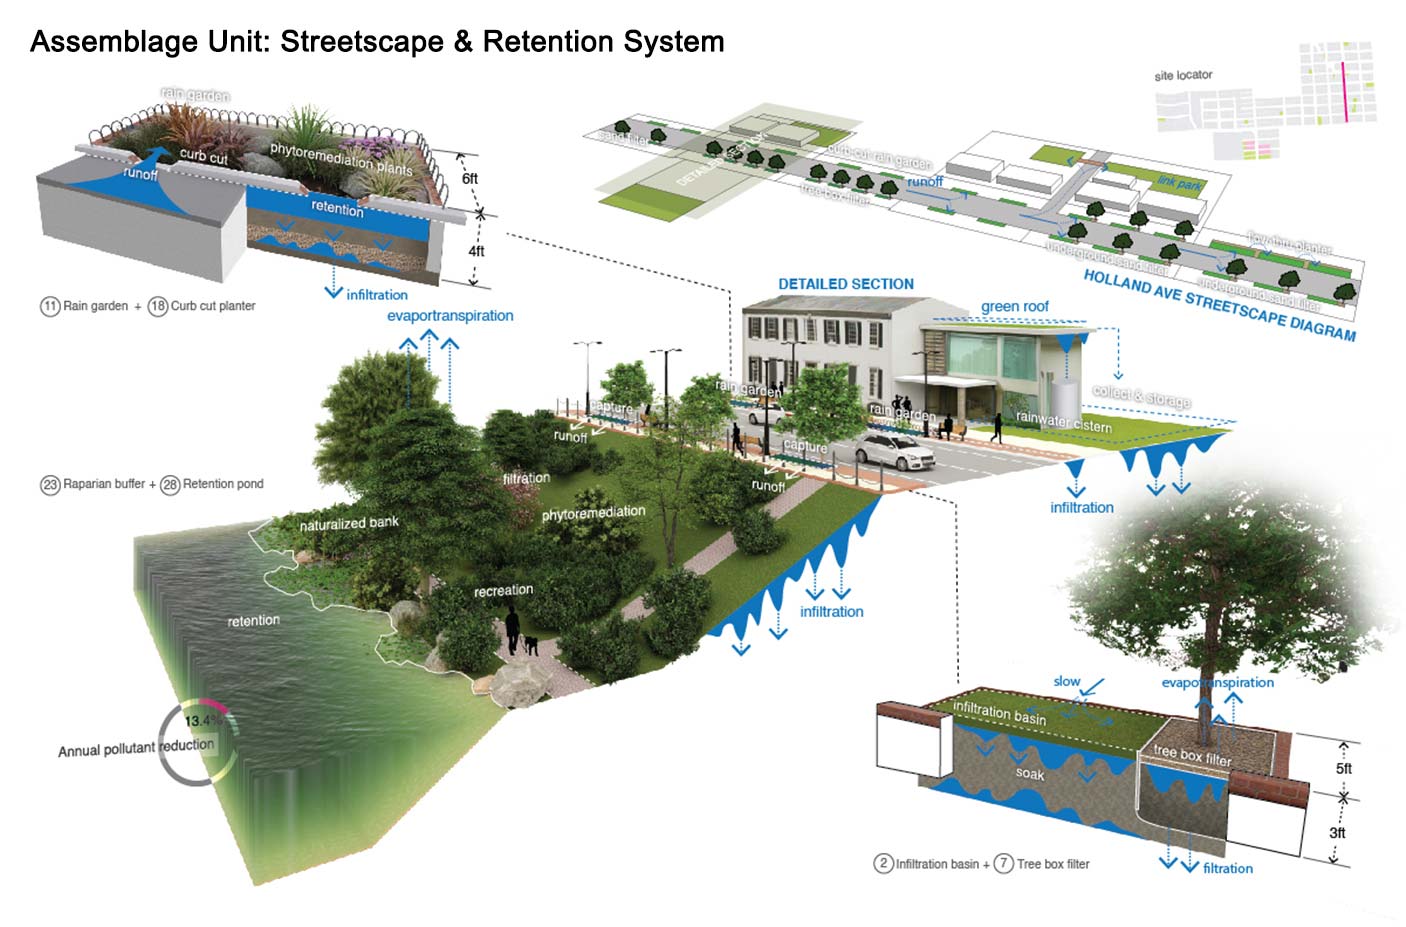
Adaptive Stormbox
To respond to this challenge, we developed an adaptive and flexible toolkit, the Green Infrastructure Adaptive Stormbox, that employs a combination of flood-proofing tools and pollution-relief techniques and can be applied broadly, based on both on-ground spatial size and underground depth to existing infrastructure.
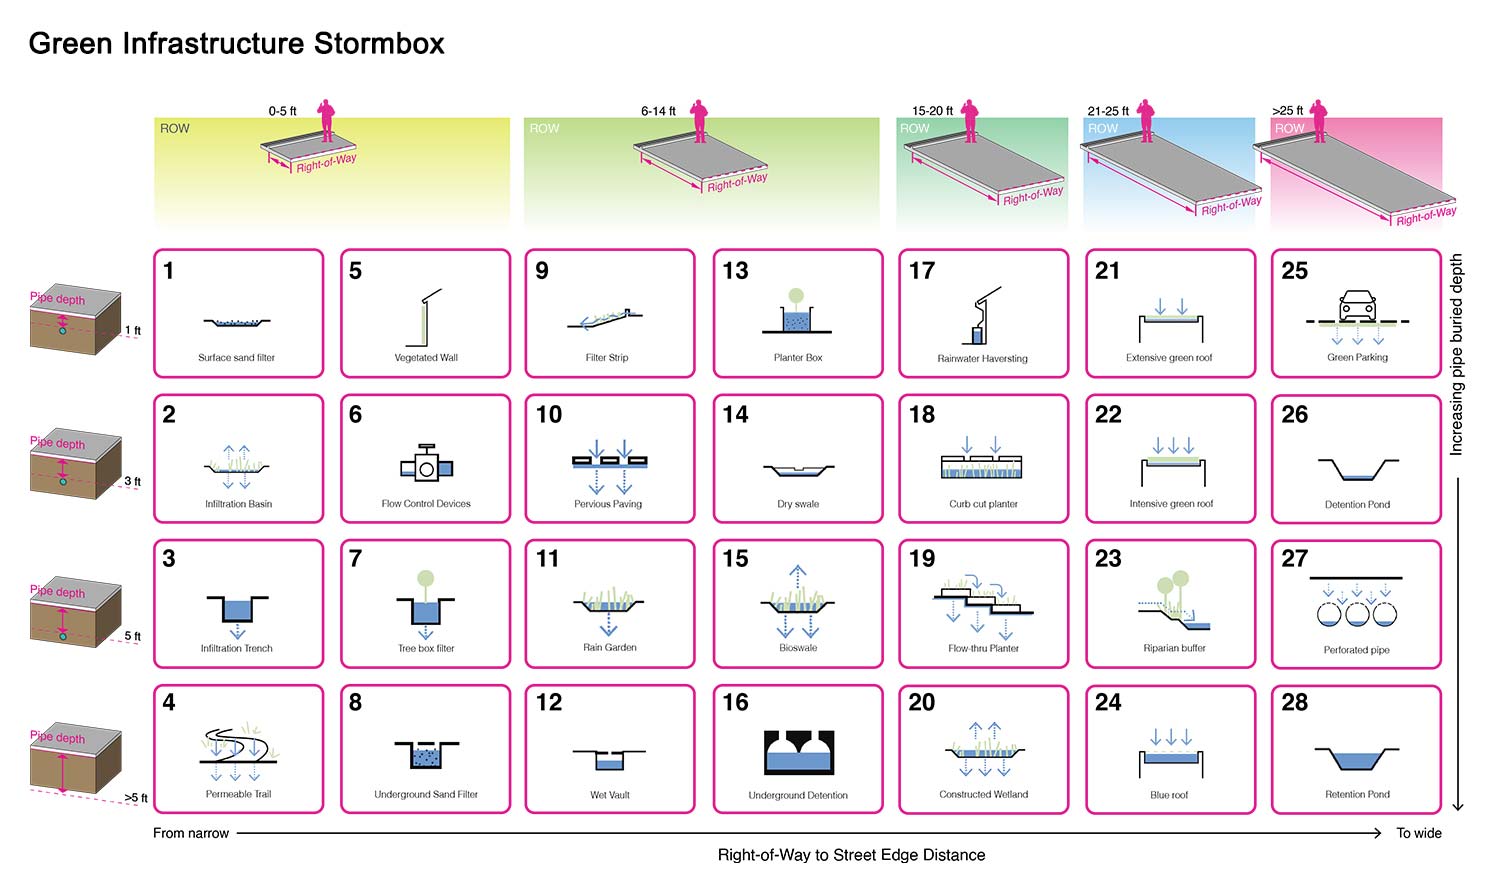
This green infrastructure stormbox provides GI solutions based on right-of way to street edge distance and pipe burial depth.
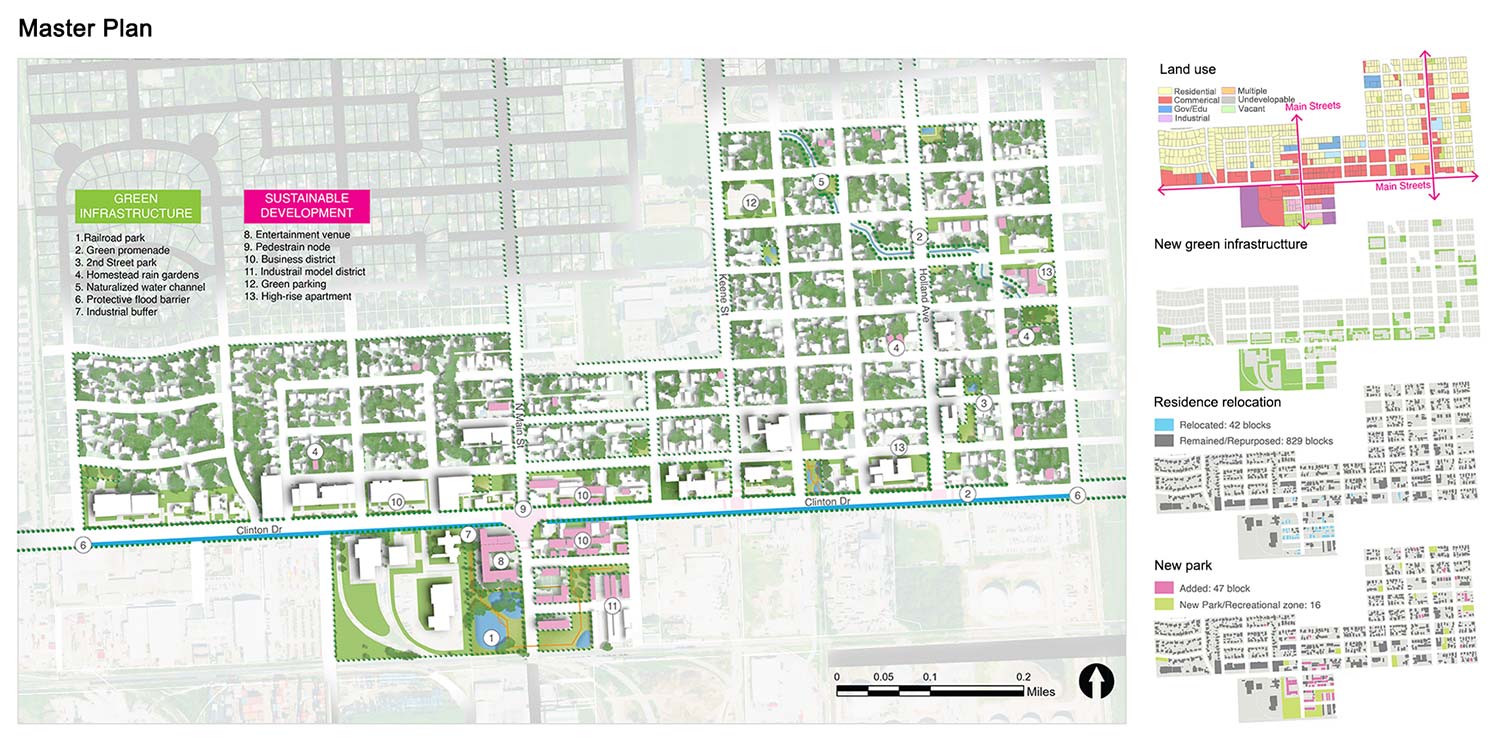
In the master plan, several types of GI from the Adaptive Stormbox are applied to newly created green spaces and existing streets to form an interconnected GI system to improve drainage and decrease contaminant issues. The design also minimizes the impermeable surface of the new business district by producing 130.9 acres of GI, which accounts for about 30.2% of the commercial area which is currently mostly impervious surfaces.
Master Plan Performance
We assessed the performance of the proposed master plan in flood and nonpoint source pollutant reduction by using Delft3D-FM coupled with the Long-Term Hydrologic Impact Assessment Low Impact Development (L-THIA). While the use of landscape performance tools which seek to quantify the impacts of designs and plans on cities has rapidly increased in recent years, no research has coupled their plans with sophisticated modeling techniques to simultaneously evaluate the impact of design on rainfall-induced inland flooding and hurricane-induced storm surge in any of the current literature. Most studies on flooding for urban planning have focused only on assessing flooding impacts under specific scenarios that are relatively static and have not focused on flooding that may occur at smaller time scales. However, in low-lying coastal areas such as Harris County, TX, determination of the impact of compound flooding from both rainfall-induced inland flooding, hurricane-induced storm surge, as well as the level of mitigation provided by flood reduction master plans is needed.
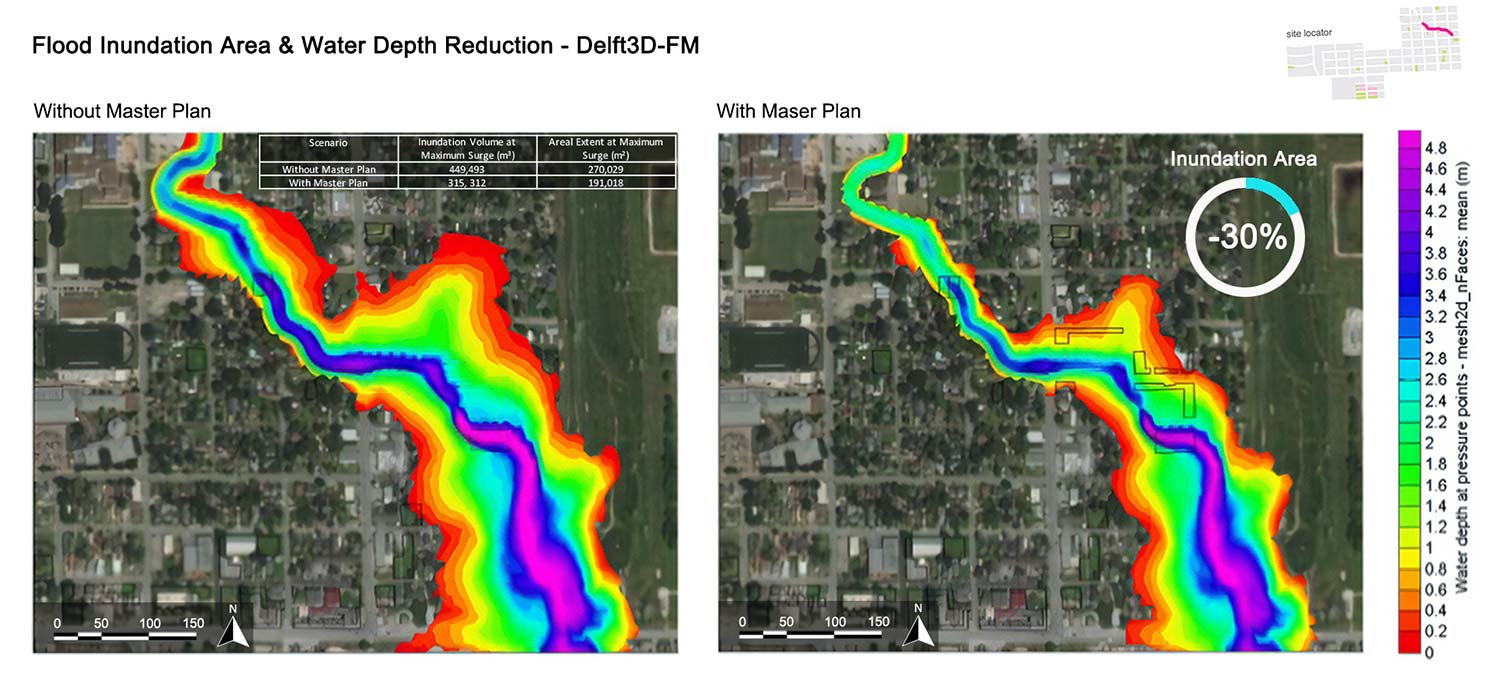
The L-THIA model estimates the annual average runoff and pollutant loads of land-use configurations for the master plan based on the city’s daily precipitation data, soil type, land-use data, and LID practice percentages. The results show that the design adds decreases stormwater runoff by 12.4% and pollutant load by 12.1%, annually. In order to determine the impact of the master plan on flooding from rainfall and/or storm surge, as noted, the Delft3D-FM model was applied. For the purposes of this research, we use HURDAT2 information for Hurricane Ike, which impacted Galveston Bay and Houston in September 2008, to drive the model. The results show both areal extent and total water volume of flooding at peak inundation and where those benefits occurred. The modeling provided a useful framework for site specific modeling for communities, allowing them to show where to expect benefits from a master plan.
Learn more about the Galena Park master plan in our publication and presentation.
L-THIA Model
The Long-Term Hydrologic Impact Assessment Low Impact Development (L-THIA) projects the probable effect of the master plan on flood reduction. The L-THIA is a straightforward analytical tool designed for planners and natural resource managers, applicable to various locations to provide estimates of long-term effect of land-use changes on stormwater and NPS pollution. It can specifically be used to simulate the impact of land use change on rainfall induced inland flooding in the. This model uses Genetic-Algorithm (GA) to help automatically calibrate Curve Numbers (CNs) for directing runoff estimations. Therefore, it can calibrate surface runoff and NPS by reducing the discrepancies between the observed and simulated data based on the optimized CNs and Even Mean Concentrations (EMCs). Many researchers have also utilized this tool to assess the performance of their designs. For instance, Galen Newman et al. investigated the potential effect of resilient community design on flood risk and pollutant loads; Ebrahim Karimi Sangchini et al. projected the effect of land cover management scenarios on runoff volume and river pollutants at the basin scale. However, the L-THIA does not account for the potential impact of extreme storms, but such an impact may significantly impact the hydrological processes and water flows of a site. Thus, the Delft3D-FM model was also applied to compensate for this limitation.
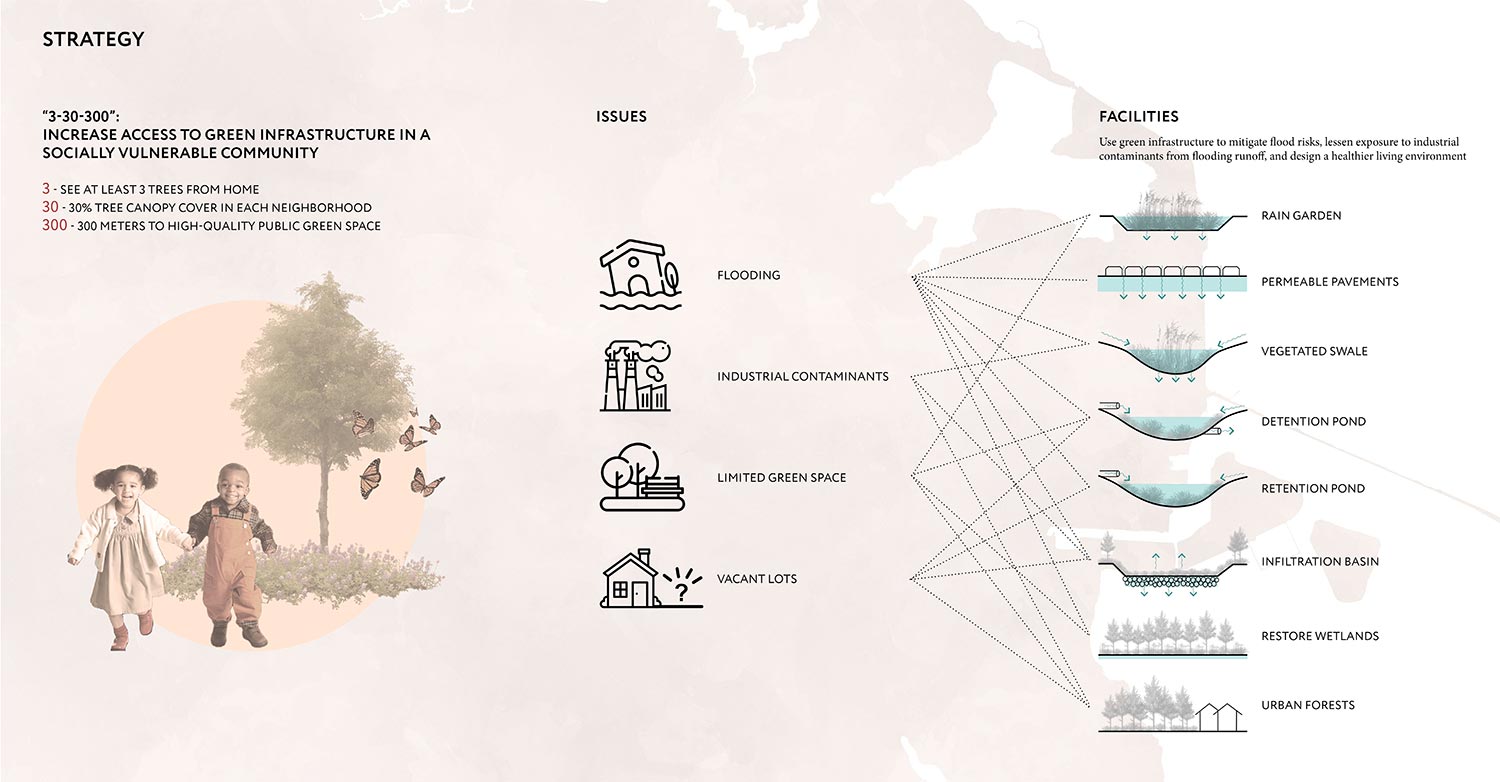
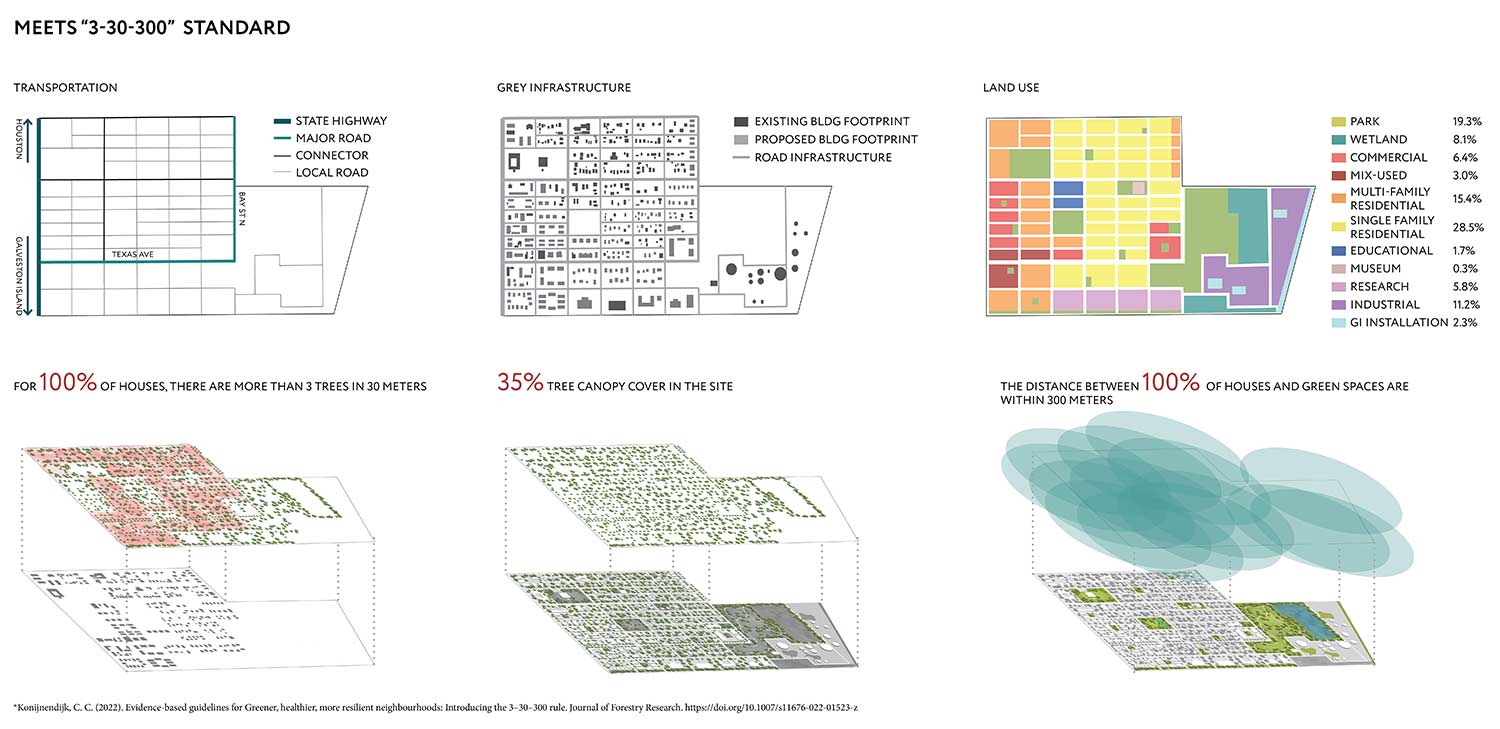
Texas City is, TX, is a highly socially vulnerable neighborhood whose population is 70% minority, 30% in poverty, 11% unemployed, 40% obese, 41% having high blood pressure, and receives less than $17,000 per year per capita. Further, the city is only comprised of 2.4% park space. We designed a nature-based, resilient master plan for a 245-acre site in Texas City, TX that is vulnerable to flooding and contamination from nearby industries using a design standard known as the 3|30|300 approach.
The 3|30|300 Approach
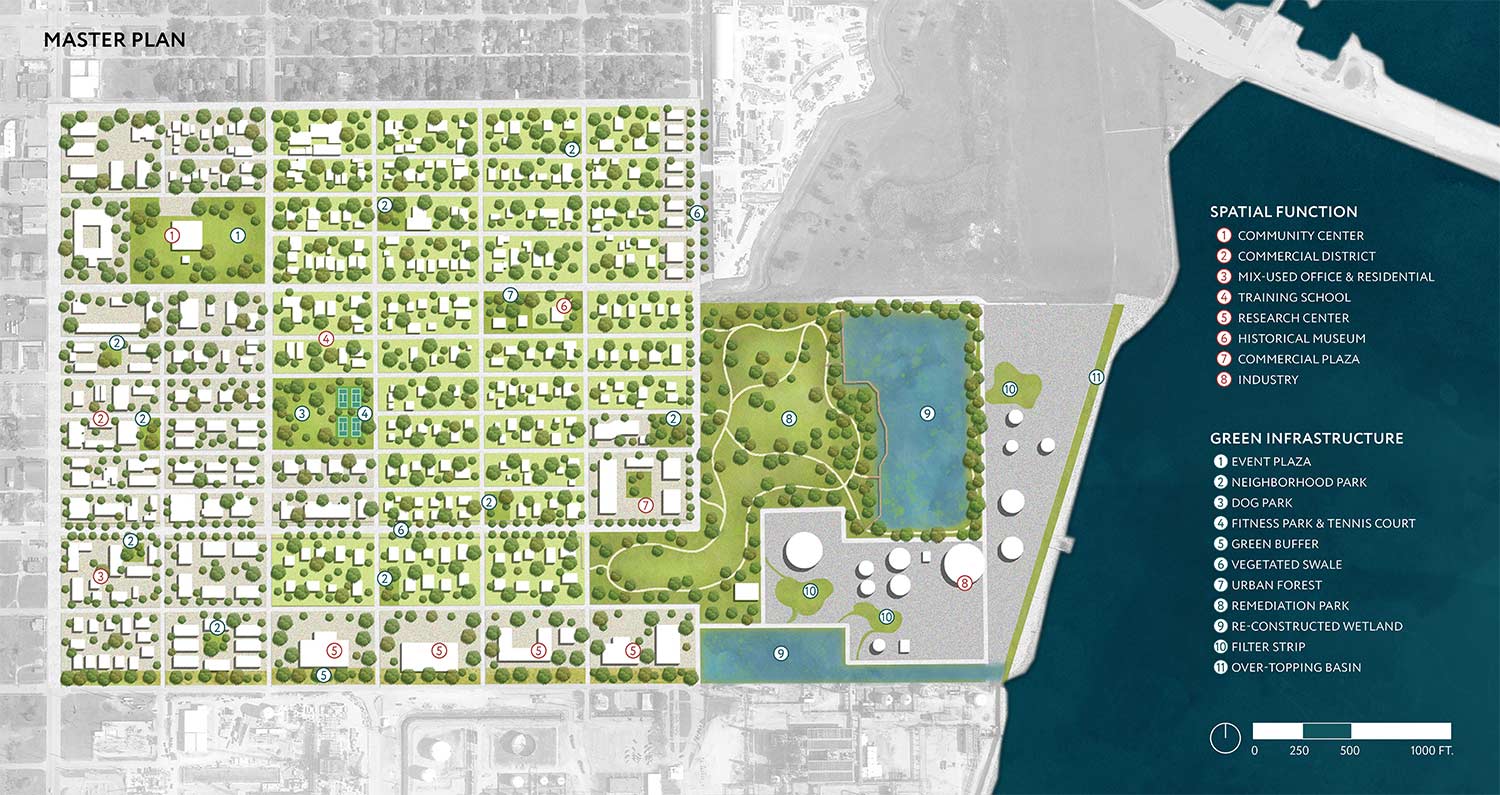
The 3|30|300 approach is an evidence-based guideline to increase community green infrastructure accessibility. The approach specifies that 1) each resident should be able to see at least three trees from their home, 2) at least 30% of the neighborhood should be covered by tree canopy, and 3) the distance to high-quality public green space for each resident should be less than 300 meters.
In an effort to achieve the 3|30|300 standard to lessen flood impacts and contamination load, the design applies facilities such as vegetated swales, bio-infiltration trenches, an over-topping basin, reconstructed wetlands, and other larger scaled green infrastructure facilities such as parks and riparian zones.
The design reaffirms the existing transportation hierarchy, using the primary arterial intersection to guide the density of the building footprint placement and new designated land uses. Medium-density land uses are located along major roadways and gradually transition to lower-density land uses. Green spaces are strategically placed throughout the site to buffer industrial land uses from the community. The design includes green infrastructure installations along the coast and scattered within the nearby industries to filter contaminants, decrease floodwaters, and minimize the impact of climate change. The design preserves iconic facilities, such as the community center and historical museum, while adding a training school, providing associated courses with surrounding industries and research centers to collect contaminant data and monitor the environment.
Overall, the design meets the 3|30|300 ratios, allowing for 100% of the homes to be surrounded by 3 or more trees, increasing the canopy coverage on-site to 35%, and allowing all residents accessibility to high-quality green space. To further assess the projected impact of implementing the 3|30|300 ratio, the Long-Term Hydrologic Impact Assessment model was utilized to determine the impact on pollutant load and runoff. Overall, despite the design increasing development by 163% in the area, the green infrastructure implemented increased green space by 3.8 times its current amount, resulting in a 16% decrease in annual chemical contaminant load and a 7% decrease in annual runoff. Specifically, Zinc (-29%), Suspended Solids (-21%), and Chemical Oxygen Demand (-10%) were the primary industrial chemicals lessened by the design.
Learn more about the Texas City master plan in this presentation.
Master Plan Performance
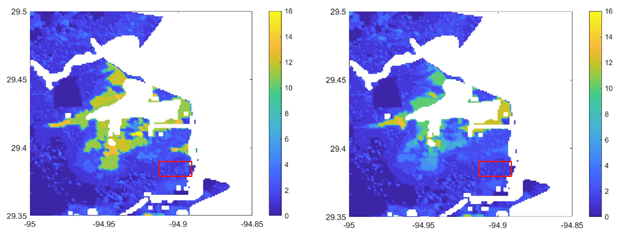
In a manner similar to that for Galena Park, the proposed master plan for nature based solution incorporation (see below) was tested with the coupled SWAT-Delft3D model. It is noted here that the geographical characteristics of Texas City are distinct from those of Galena Park. The path for hurricane surge to reach Galena Park is through the Ship Channel and up Hunting Bayou and Panther Creek, two small waterways going through the community. In addition, the embankments abutting these waterways are steep. These factors would slow the inundation of the area by surge and allow the enhanced drainage from the master plan to match the infilling rate from the waterways. In contrast, Texas City is exposed to Galveston Bay, with terrain that is much flatter than the embankments of Galena Park, and the surge is much faster as a result – likely faster than the master plan is capable of immediately draining. The net effect is that, while the maximum flood elevation throughout Texas City is little changed by the presence of these nature based features, the residence time is reduced. The figure below shows a map of residence time (in days) for the portion of Texas City in the vicinity of the master plan (approximate location of master plan NBS shown in red). The left map is the residence time without the master plan in place, while the right is with the master plan in place. The reduction in residence time with the master plan is evident throughout the Texas City area modeled.
Chemical Transport Pathways
The Delft3D model incorporates a particle tracking algorithm that was used here as a possible proxy for contaminant transport. These particles (termed “drogues”) represented a possible contaminant spill at each facility. When the flood or hurricane surge reached the facility, the drogue would begin to move, and would thereafter follow the predominant flow pattern. The effect of dilution on contaminant concentration was not included; however, if the water mass represented by the drogue was contaminated at any time, the drogues could determine the overall distance traveled by that contamination.
The drogue analysis was not used in the creation of the vulnerability maps, since a probabilistic approach to drogue placement and transport would be required to reduce the uncertainty of the input information. However, the analysis can be used as a means of evaluating the impact of the master plan. In the figure below, the results of two SWAT-Delft3D coupled model simulations – one with the master plan (shown in the blue rectangle) and one without – are shown. The blue line indicates the drogue path with the master plan, and the red line shows the path without the master plan. A drogue is placed at a facility (green oval) at the initial time step of simulated surge inundation from Hurricane Ike. As the surge arrives at the facility and begins to move the drogue, both simulations show the same path, with the blue line overlying the red. At this stage, the infilling rate of the surge is far greater than the assumed drainage rate from the master plan, and the master plan has little effect. However, as the surge begins to slow, the drogue path begins to show the effect of drainage by the master plan. At this point, the red and blue path lines begin to diverge. The red line (simulation without the master plan) shows continued transport away from the master plan, eventually entering the waterways to the southwest. On the other hand, the blue line (simulation with the master plan) shows transport reversal back toward the northeast, skirting the master plan. This is largely due to the reduced water level over the master plan, as the drainage it imparts on the surge begins to take noticeable effect.
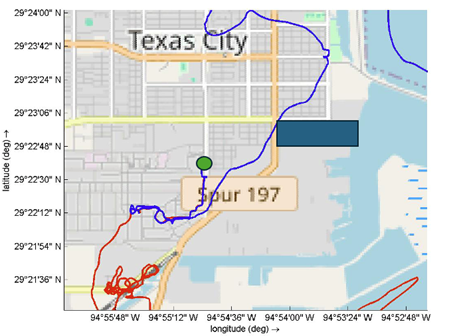
We caution that the change in the surge levels which could lead to these drogue paths are sensitive to assumed drainage values for the master plan. It is quite likely that very different transport paths would result if different drainage rates were input to the model. The primary conclusion, however, is that possible chemical transport paths might be a useful evaluative metric (along with residence time and maximum water level) for the placement of nature-based infrastructure as a flooding mitigation measure.